미국과 유럽의 보건당국에서 공식적으로 발표한 계절성 독감 현황입니다.
미국 질병관리본부(CDC)의 추정에 따르면, 해마다 2만4천명이 계절성 독감으로 사망하고
있습니다. 지난 2003년 겨울에는 무려 4만8천명이 계절성 독감으로 사망한 것으로
추정하고 있습니다.
올해는 미국과 유럽에서 H3N2 타입의 계절성 독감 바이러스가 조금 더 일찍 유행하고
있으며, 미국 전역에서 2000여 명이 독감으로 입원했으며, 그중에서 어린이 18명이
사망했다고 밝혔습니다.
미국은 4주전부터 최근까지 2.8%에서 5.6%로 증가하였으며, 중국 북부지역도 3.2%에서
4.2%로 증가 추세에 있습니다. 우리나라에서 주로 유행하고 있는 계절성 인플루엔자
바이러스는 H1N1형이고, 미국과 중국에서 주로 유행하고 있는 바이러스는 H3N2형입니다.
미국이나 중국에서 들어오는 선박이나 배를 통한 여행객과 화물 등을 통해 그 지역에서
현재 유행하고 있는 H3N2형이 국내에서 유행할 가능성도 높습니다.
다만 이번 독감의 바이러스 유형과 전파 양상으로 보면… 현재까진 2009년 전세계적인
신종플루 대유행과 같은 비상사태가 발생할 가능성은 현재로서는 별로 없어 보입니다.
계절성 독감의 피크 시기가 예년보다 조금 더 앞당겨 진 정도의 상황이라 판단되며,
어린이와 노약자는 독감 예방주사를 접종받을 필요가 있고… 보건당국은 전 세계적인 상황을
예의주시하면서 백신과 치료약을 충분히 비축해두고, 입원실 확보 등 신속 대응체계를 점검
할 필요가 있을 것 같습니다.
그래도 해마다 겨울철 인플루엔자 바이러스로 인하여 수 많은 사람들이 사망하고 있으며,
올해는 평균보다 사망자 수가 더 늘어날 가능성이 높다는 점을 유의해야 합니다.
================

2012-2013 Influenza Season Week 52 ending December 29, 2012
All data are preliminary and may change as more reports are received.
Synopsis:
During week 52 (December 23-29), influenza activity increased in the U.S.
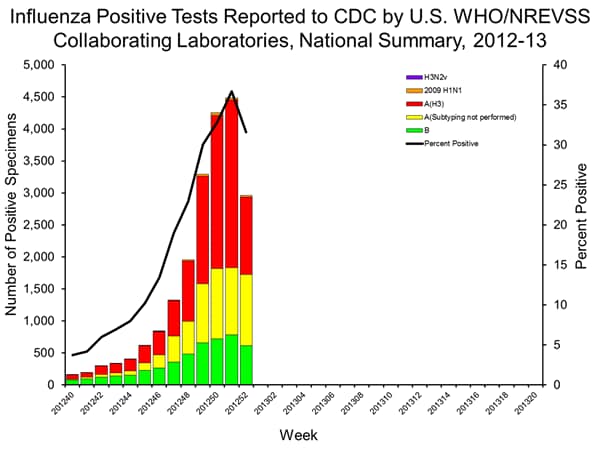
- Viral Surveillance: Of 9,363 specimens tested and reported by U.S. World Health Organization (WHO) and National Respiratory and Enteric Virus Surveillance System (NREVSS) collaborating laboratories, 2,961 (31.6%) were positive for influenza.
- Pneumonia and Influenza Mortality: The proportion of deaths attributed to pneumonia and influenza (P&I) was below the epidemic threshold.
- Influenza-Associated Pediatric Deaths: Two influenza-associated pediatric deaths were reported and were associated with influenza B viruses.
- Outpatient Illness Surveillance: The proportion of outpatient visits for influenza-like illness (ILI) was 5.6%; above the national baseline of 2.2%. Nine of 10 regions reported ILI above region-specific baseline levels. New York City and 29 states experienced high ILI activity; 9 states experienced moderate ILI activity; 4 states experienced low ILI activity; 6 states experienced minimal ILI activity, and the District of Columbia and 2 states had insufficient data.
- Geographic Spread of Influenza: Forty-one states reported widespread geographic influenza activity; 7 states reported regional activity; the District of Columbia reported local activity; 1 state reported sporadic activity; Guam reported no influenza activity, and Puerto Rico, the U.S. Virgin Islands, and 1 state did not report.
A description of surveillance methods is available at: http://www.cdc.gov/flu/weekly/overview.htm
| HHS Surveillance Regions* | Data for current week | Data cumulative since September 30, 2012 (Week 40) | ||||||||
|---|---|---|---|---|---|---|---|---|---|---|
| Out-patient ILI† | % positive for flu‡ | Number of jurisdictions reporting regional or widespread activity§ | 2009 H1N1 | A (H3) | A(Subtyping not performed) | B | Pediatric Deaths | |||
| Nation | Elevated | 31.6% | 48 of 54 | 194 | 10,612 | 5,621 | 5,621 | 18 | ||
| Region 1 | Elevated | 45.3% | 6 of 6 | 18 | 850 | 204 | 59 | 1 | ||
| Region 2 | Elevated | 36.6% | 2 of 4 | 21 | 722 | 683 | 161 | 3 | ||
| Region 3 | Elevated | 43.3% | 4 of 6 | 37 | 1,688 | 105 | 171 | 0 | ||
| Region 4 | Elevated | 28.3% | 8 of 8 | 20 | 1,410 | 3,368 | 1,058 | 4 | ||
| Region 5 | Elevated | 58.4% | 6 of 6 | 29 | 1,985 | 174 | 417 | 5 | ||
| Region 6 | Elevated | 24.7% | 5 of 5 | 7 | 599 | 529 | 971 | 4 | ||
| Region 7 | Elevated | 33.9% | 4 of 4 | 2 | 868 | 173 | 422 | 0 | ||
| Region 8 | Elevated | 30.3% | 6 of 6 | 25 | 940 | 297 | 1,174 | 0 | ||
| Region 9 | Normal | 22.9% | 3 of 5 | 32 | 599 | 58 | 137 | 0 | ||
| Region 10 | Elevated | 31.5% | 4 of 4 | 3 | 951 | 30 | 138 | 1 | ||
*HHS regions (Region 1 CT, ME, MA, NH, RI, VT; Region 2: NJ, NY, Puerto Rico, US Virgin Islands; Region 3: DE, DC, MD, PA, VA, WV; Region 4: AL, FL, GA, KY, MS, NC, SC, TN; Region 5: IL, IN, MI, MN, OH, WI; Region 6: AR, LA, NM, OK, TX; Region 7: IA, KS, MO, NE; Region 8: CO, MT, ND, SD, UT, WY; Region 9: AZ, CA, Guam, HI, NV; and Region 10: AK, ID, OR, WA).
† Elevated means the % of visits for ILI is at or above the national or region-specific baseline
‡ National data are for current week; regional data are for the most recent three weeks
§ Includes all 50 states, the District of Columbia, Guam, Puerto Rico, and U.S. Virgin Islands
U.S. Virologic Surveillance:
WHO and NREVSS collaborating laboratories located in all 50 states and Puerto Rico report to CDC the number of respiratory specimens tested for influenza and the number positive by influenza virus type and influenza A virus subtype. Region specific data can be found at http://gis.cdc.gov/grasp/fluview/fluportaldashboard.html.
| Week 52 | |
|---|---|
| No. of specimens tested | 9,363 |
| No. of positive specimens (%) | 2,961 (31.6%) |
| Positive specimens by type/subtype | |
| Influenza A | 2,346 (79.2%) |
| 2009 H1N1 | 25 (1.1%) |
| Subtyping not performed | 1,112 (47.4%) |
| H3 | 1,209 (51.5%) |
| Influenza B | 615 (20.8%) |
View National and Regional Level Graphs and Data | View Chart Data | View Full Screen | View PowerPoint Presentation
Since the start of the season, influenza A (H3N2) viruses have predominated nationally, followed by influenza B viruses, while 2009 H1N1 viruses have been identified rarely. The predominant circulating virus has varied by state and by region.
Antigenic Characterization:
CDC has antigenically characterized 413 influenza viruses [17 2009 H1N1 viruses, 281 influenza A (H3N2) viruses, and 115 influenza B viruses] collected by U.S. laboratories since October 1, 2012.
2009 H1N1 [17]:
- • All 17 2009 H1N1 viruses tested were characterized as A/California/7/2009-like, the influenza A (H1N1) component of the 2012-2013 influenza vaccine for the Northern Hemisphere.
Influenza A (H3N2) [281]:
- 279 (99.3%) of the 281 H3N2 influenza viruses tested have been characterized as A/Victoria/361/2011-like, the influenza A (H3N2) component of the 2012-2013 Northern Hemisphere influenza vaccine.
- 2 (0.7%) of the 281 H3N2 viruses tested showed reduced titers with antiserum produced against A/Victoria/361/2011.
Influenza B (B/Yamagata/16/88 and B/Victoria/02/87 lineages) [115]:
- Yamagata Lineage [79]: 79 (68.7%) of the 115 influenza B viruses tested so far this season have been characterized as B/Wisconsin/1/2010-like, the influenza B component of the 2012-2013 Northern Hemisphere influenza vaccine.
- Victoria Lineage [36]: 36 (31.3%) of 115 influenza B viruses tested have been from the B/Victoria lineage of viruses.
Antiviral Resistance:
Testing of 2009 H1N1, influenza A (H3N2), and influenza B virus isolates for resistance to neuraminidase inhibitors (oseltamivir and zanamivir) is performed at CDC using a functional assay. Additional 2009 influenza A (H1N1) clinical samples are tested for a single mutation in the neuraminidase of the virus known to confer oseltamivir resistance (H275Y). The data summarized below combine the results of both testing methods. These samples are routinely obtained for surveillance purposes rather than for diagnostic testing of patients suspected to be infected with antiviral-resistant virus.
High levels of resistance to the adamantanes (amantadine and rimantadine) persist among 2009 influenza A (H1N1) and A (H3N2) viruses (the adamantanes are not effective against influenza B viruses). As a result, data from adamantane resistance testing are not presented below.
| Oseltamivir | Zanamivir | |||
|---|---|---|---|---|
| Virus Samples tested (n) | Resistant Viruses, Number (%) | Virus Samples tested (n) | Resistant Viruses, Number (%) | |
| Influenza A (H3N2) | 526 | 0 (0.0) | 526 | 0 (0.0) |
| Influenza B | 226 | 0 (0.0) | 226 | 0 (0.0) |
| 2009 H1N1 | 39 | 0 (0.0) | 30 | 0 (0.0) |